While developing Shortcut, I repeatedly encountered a problem:
When multiple unrelated instructions are given at once, the LLM drops some or degrades in quality. e.g., "summarize my emails" + "draft a reply" + "add to calendar" → first task done well, the rest ignored.
I'm exploring MAS / Dynamically Self-Structured MAS to address this. But before any of that — before proof of concept, before experiments — I needed a way to measure the problem first.
The IFScale benchmark solves this by quantifying how instruction-following degrades as the number of instructions increases.
Motivation
Recent models push context windows past 1M tokens: DeepSeek V4 Pro, Claude Opus 4.7, Gemini 2.5 Pro, and more.
The common assumption: if it fits in the context window, the LLM will handle it.
Researchers have uncovered common failure patterns in LLMs — primacy effects, silent instruction dropping, quality degradation under multiple constraints.
At the time of publication, none of these had been systematically measured as instruction density scales.
Benchmark
What They Test
The Gap
IFScale's Answer
FollowBench
Multi-constraint tasks e.g., "Write 300 words, include a table, end politely"
Only 5–10 per prompt
Tests 10 to 500
ComplexBench
Multi-step compositions e.g., "Summarize, then translate, then format as JSON"
Complex but few instructions
Systematically varies count
IFEval
Verifiable constraints e.g., "Use 4 paragraphs, start with Dear, no commas"
Fixed count, never varied
Varies density in steps of 10
InfoBench
Diverse instruction types e.g., "Respond in French, use bullet points, avoid very"
Count not a variable
Makes count the independent variable
DIM-Bench
Distractor resilience e.g., "Write a summary (ignore: list primes under 100)"
Only tests irrelevant instructions
Measures relevant instruction-following across densities
Context windows have grown from thousands to a million tokens. But as the table shows, no existing benchmark tests how instruction-following degrades when instruction count itself becomes the variable — even though omission errors and primacy effects are already known problems.
M — Methods
Task & Evaluation
IFScale — a benchmark measuring instruction-following degradation as instruction count scales from 10 to 500. 20 models, 7 providers, 50 density levels, 5 seeds each.
The Task
Write a professional business report. Include every keyword from the instruction list. Each instruction is a single constraint:
"Include the exact word accountability"
"Include the exact word strategy"
"Include the exact word compliance" … × N instructions. Only the count changes — 10, 20, 30, …, 500. The task stays the same.
Why this works: simple enough to grade with regex — no ambiguity. The underlying job never changes, so instruction count is the only variable.
Exact match → counted as satisfied. e.g., "accountability" appears
Not found → omission error (not satisfied). e.g., never appears
Accuracy = keywords satisfied ÷ N
Each density level runs 5 times with different random seeds. The graph plots the average with ±1 standard deviation. o4-mini checks coherence (1–10); outputs that are only keyword lists, too short, or score below 6 are retried.
M — Methods
Vocabulary Construction Pipeline
How 500 curated business terms were created from SEC 10-K filings (business reports)
STEP 1Extracto4-mini extracts top 500 candidate terms per SEC 10-K filing
STEP 2DeduplicateFuzz-match across all filings to remove duplicates
STEP 3ValidateLook-back check: term must appear as a whole word in the raw 10-K corpus
STEP 4Filter & NormalizeZipf frequency ≥ 1.0 + WordNet lemmatization to collapse morphological variants
% of required keywords the model successfully includes
Std Dev
How much accuracy varies across 5 runs — measures consistency
Omission Rate
How often keywords are completely missing vs. approximated
Primacy Ratio
Errors in last ⅓ ÷ errors in first ⅓ — measures position bias
Latency
Time from prompt to completed output, in seconds
Coherence
o4-mini rates report quality on a 1–10 rubric
R — Results
Overall Performance
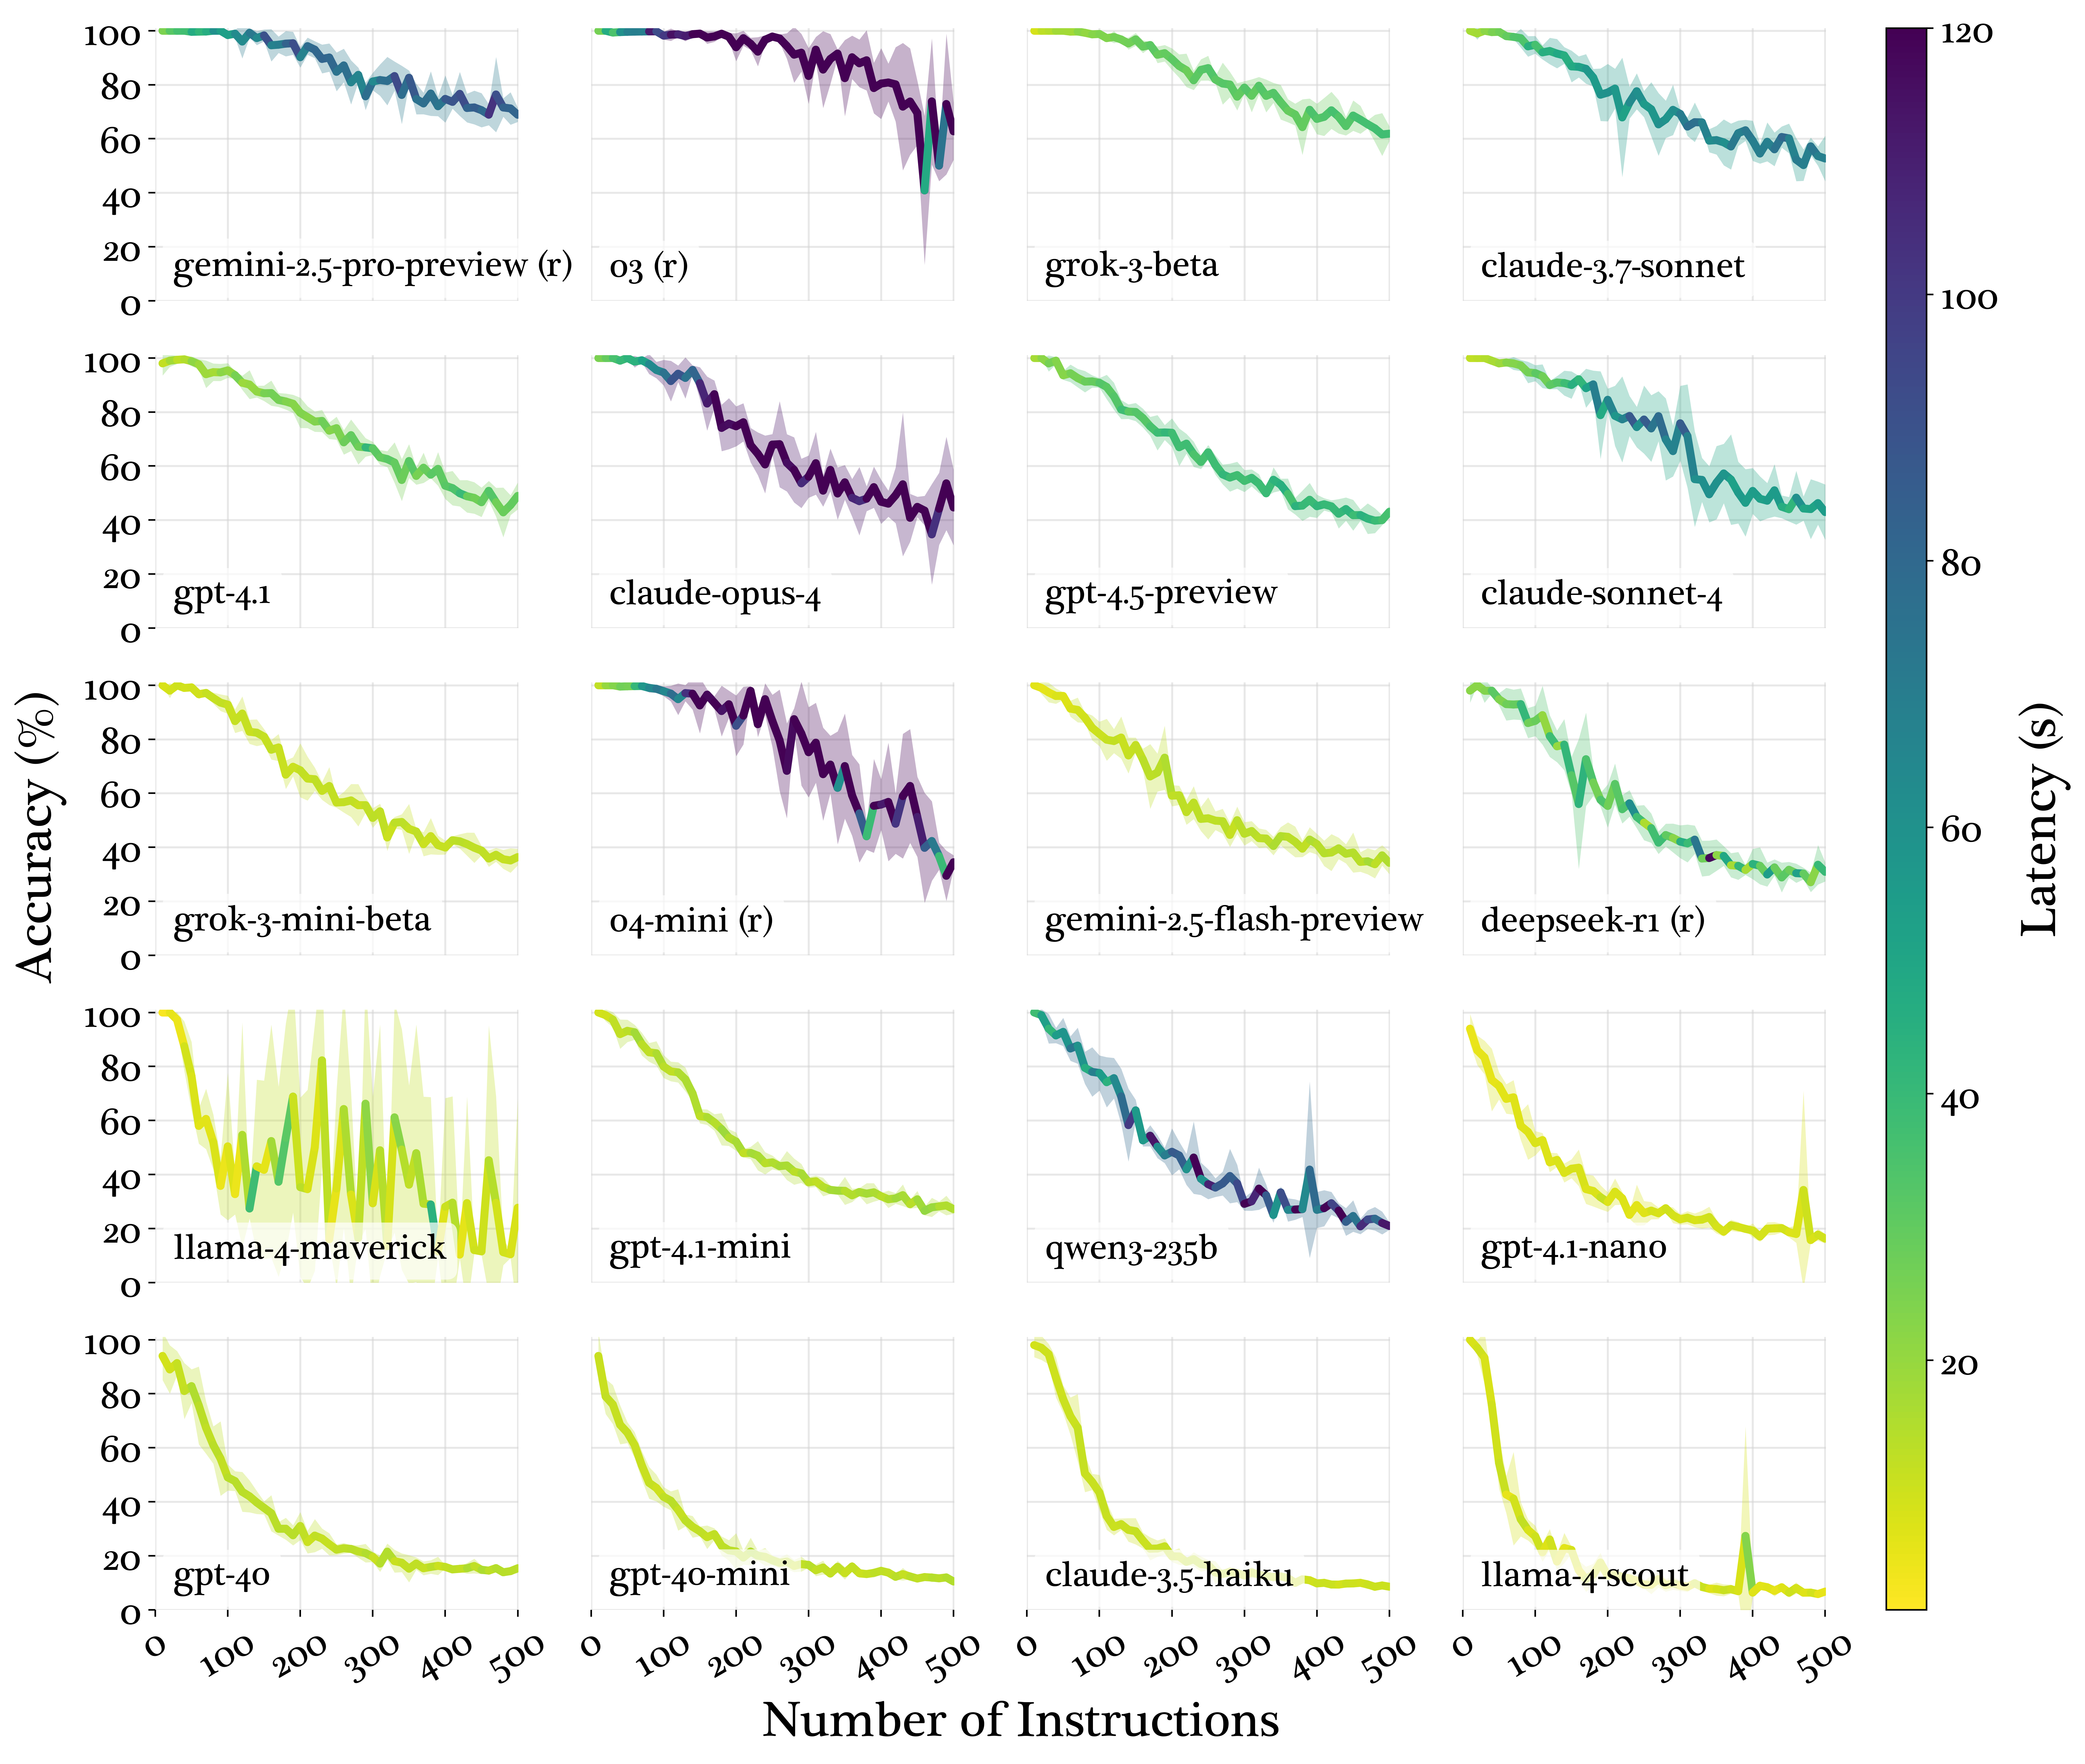
Figure 2: Each line = one model. X-axis = number of instructions (10→500). Y-axis = accuracy (%). Colder colors = lower latency, warmer = higher. Shaded band = ±1 standard deviation across 5 runs. Models ranked by accuracy at 500 instructions.
How to read this: At low densities (left), most models score near 100%. As density increases (right), lines diverge — revealing each model's capacity limit. The shaded band shows how consistent the model is across repeated runs.
Top 3 at 500: gemini-2.5-pro 67.3% · o3 62.8% · grok-3 61.9% Surprises: claude-3.7-sonnet beats newer claude-opus-4 · deepseek-r1 underperforms its reasoning label · gpt-4o decays like a much smaller model
R — Results
Three Degradation Patterns
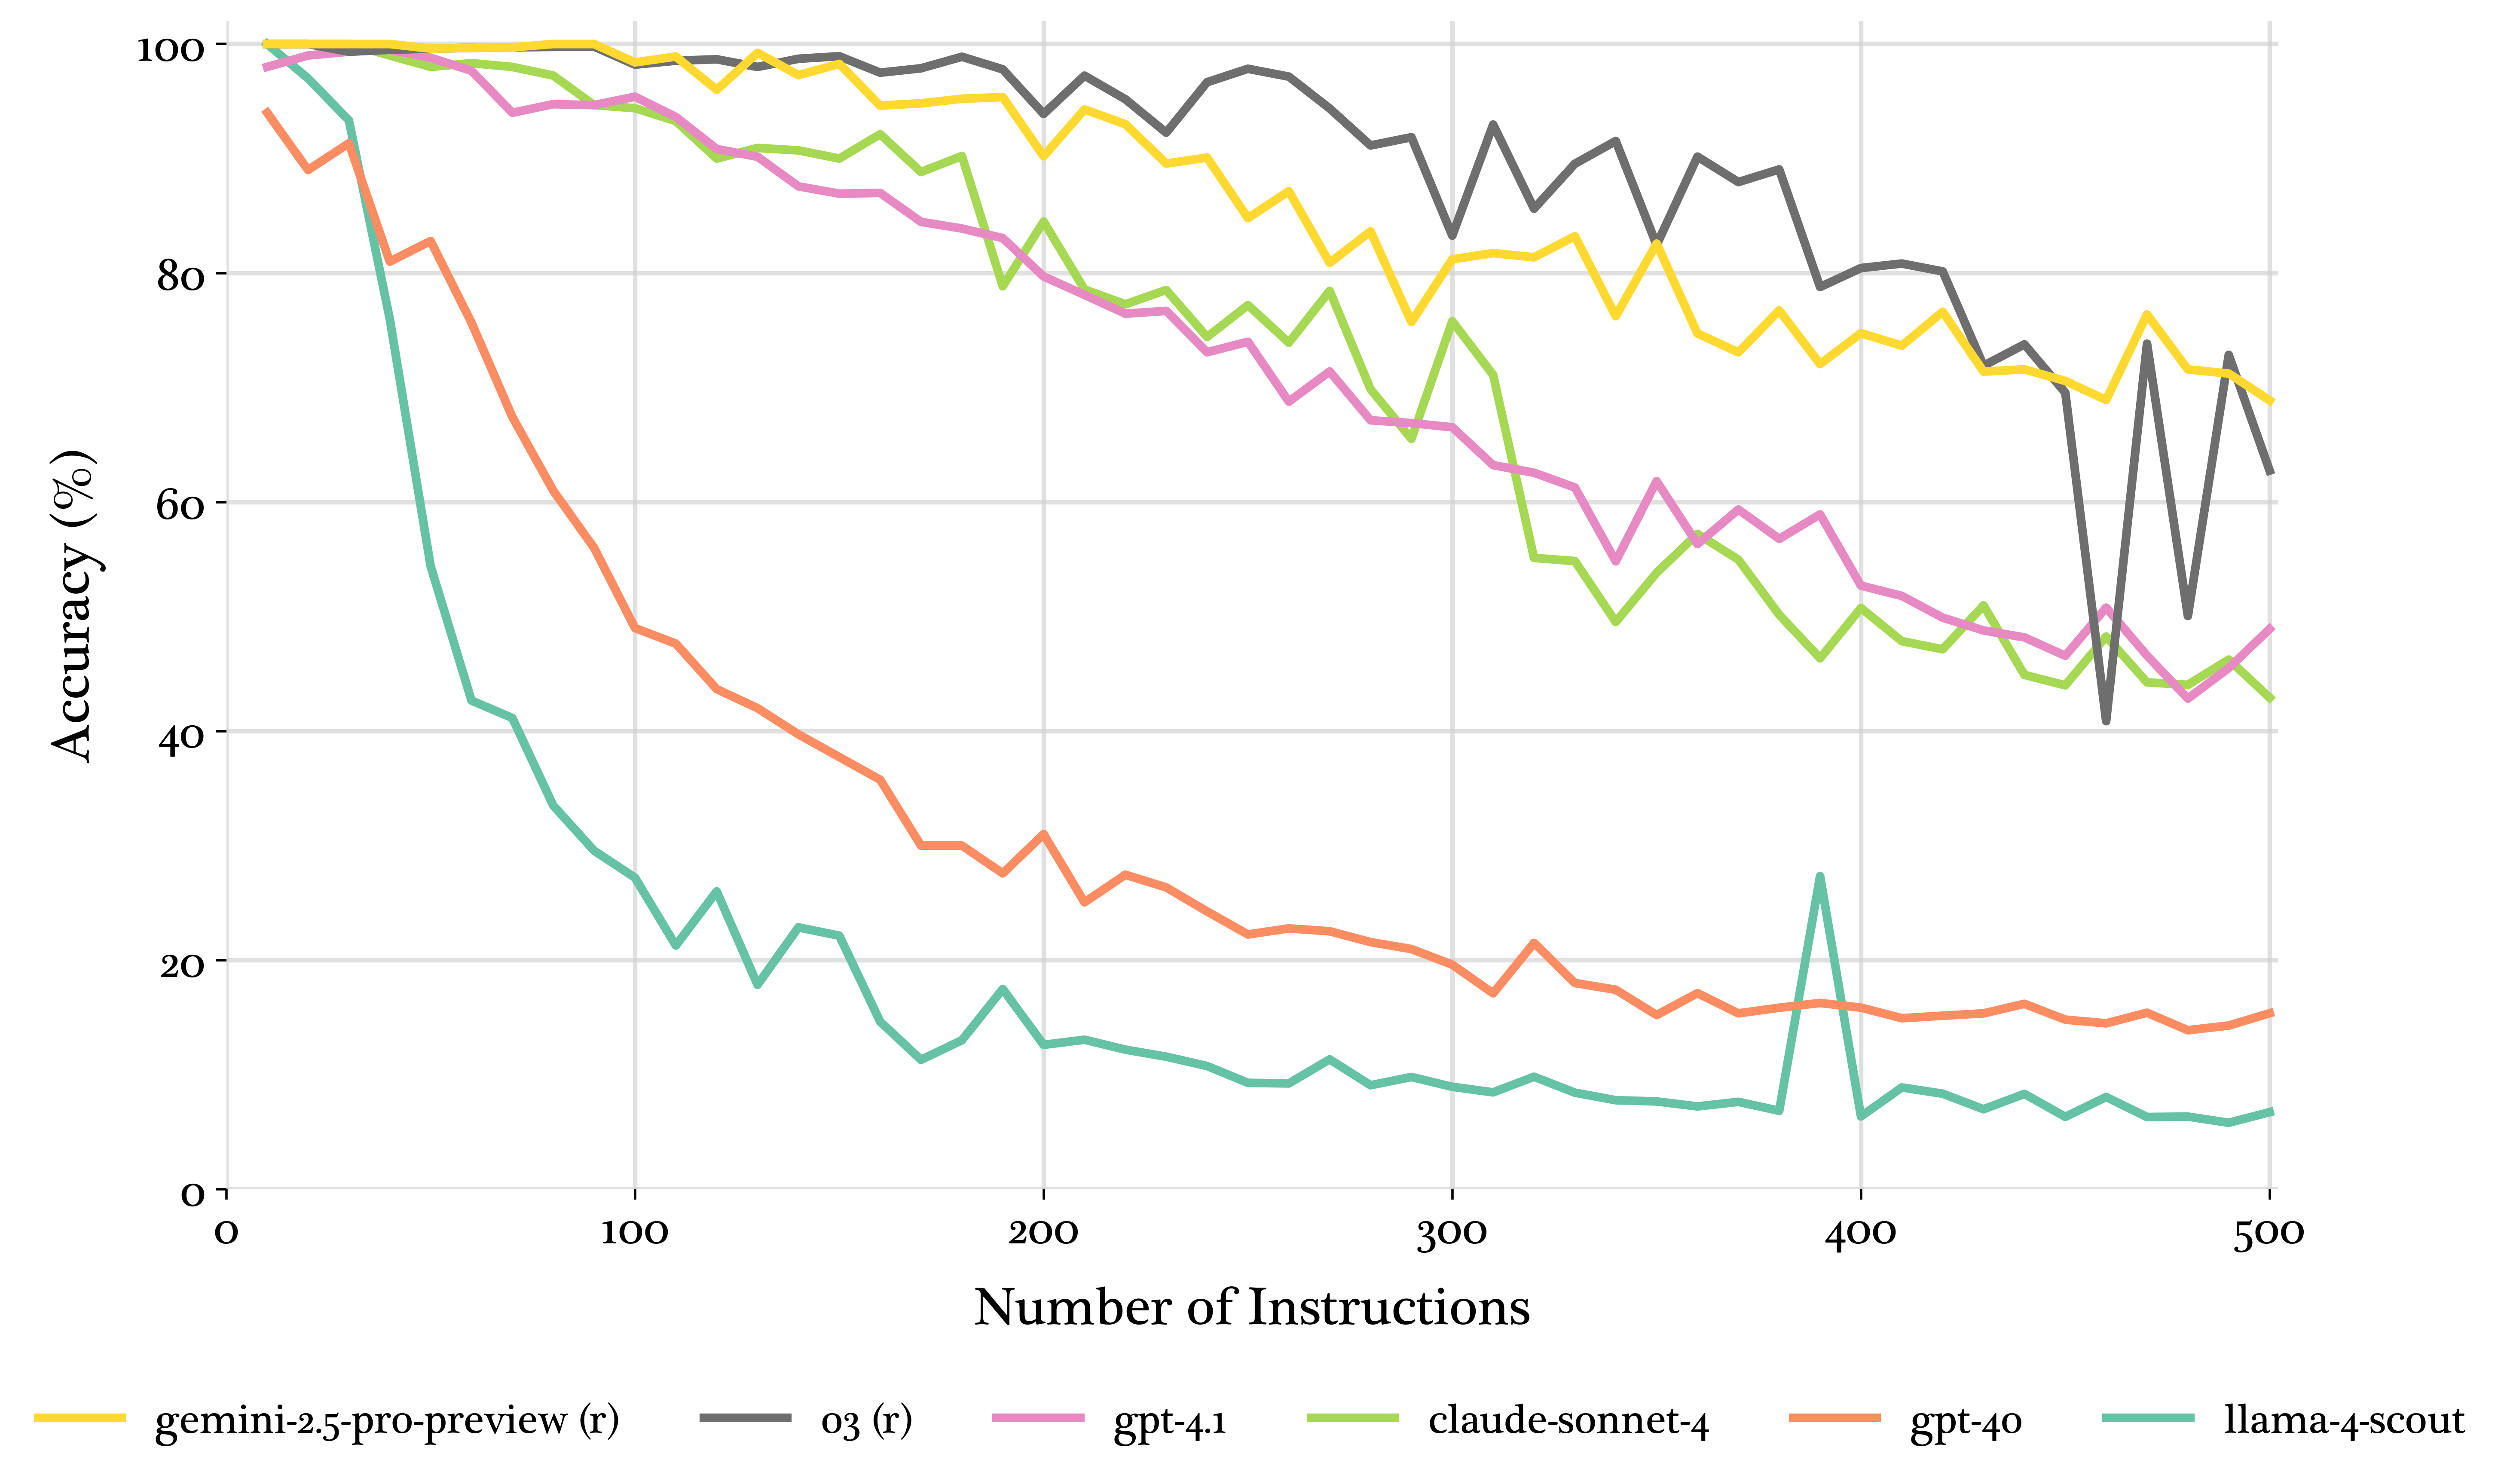
Figure 1: Three panels — one per degradation pattern. X-axis = instruction count, Y-axis = accuracy. Note how the shape of the drop differs fundamentally between patterns.
Threshold Decay
Holds near-perfect until a critical point, then drops steeply with rising variance. What this means: the model has a capacity cliff — it's reliable right up until it isn't. o3, gemini-2.5-pro
Linear Decay
Steady, predictable decline across all densities. What this means: you can estimate accuracy for any instruction count — no sudden surprises. gpt-4.1, claude-sonnet-4
Exponential Decay
Rapid early drop, then flatlines at ~7–15%. What this means: overwhelmed by even a few dozen instructions — don't use beyond 50. gpt-4o, llama-4-scout
R — Results
Primacy Effects
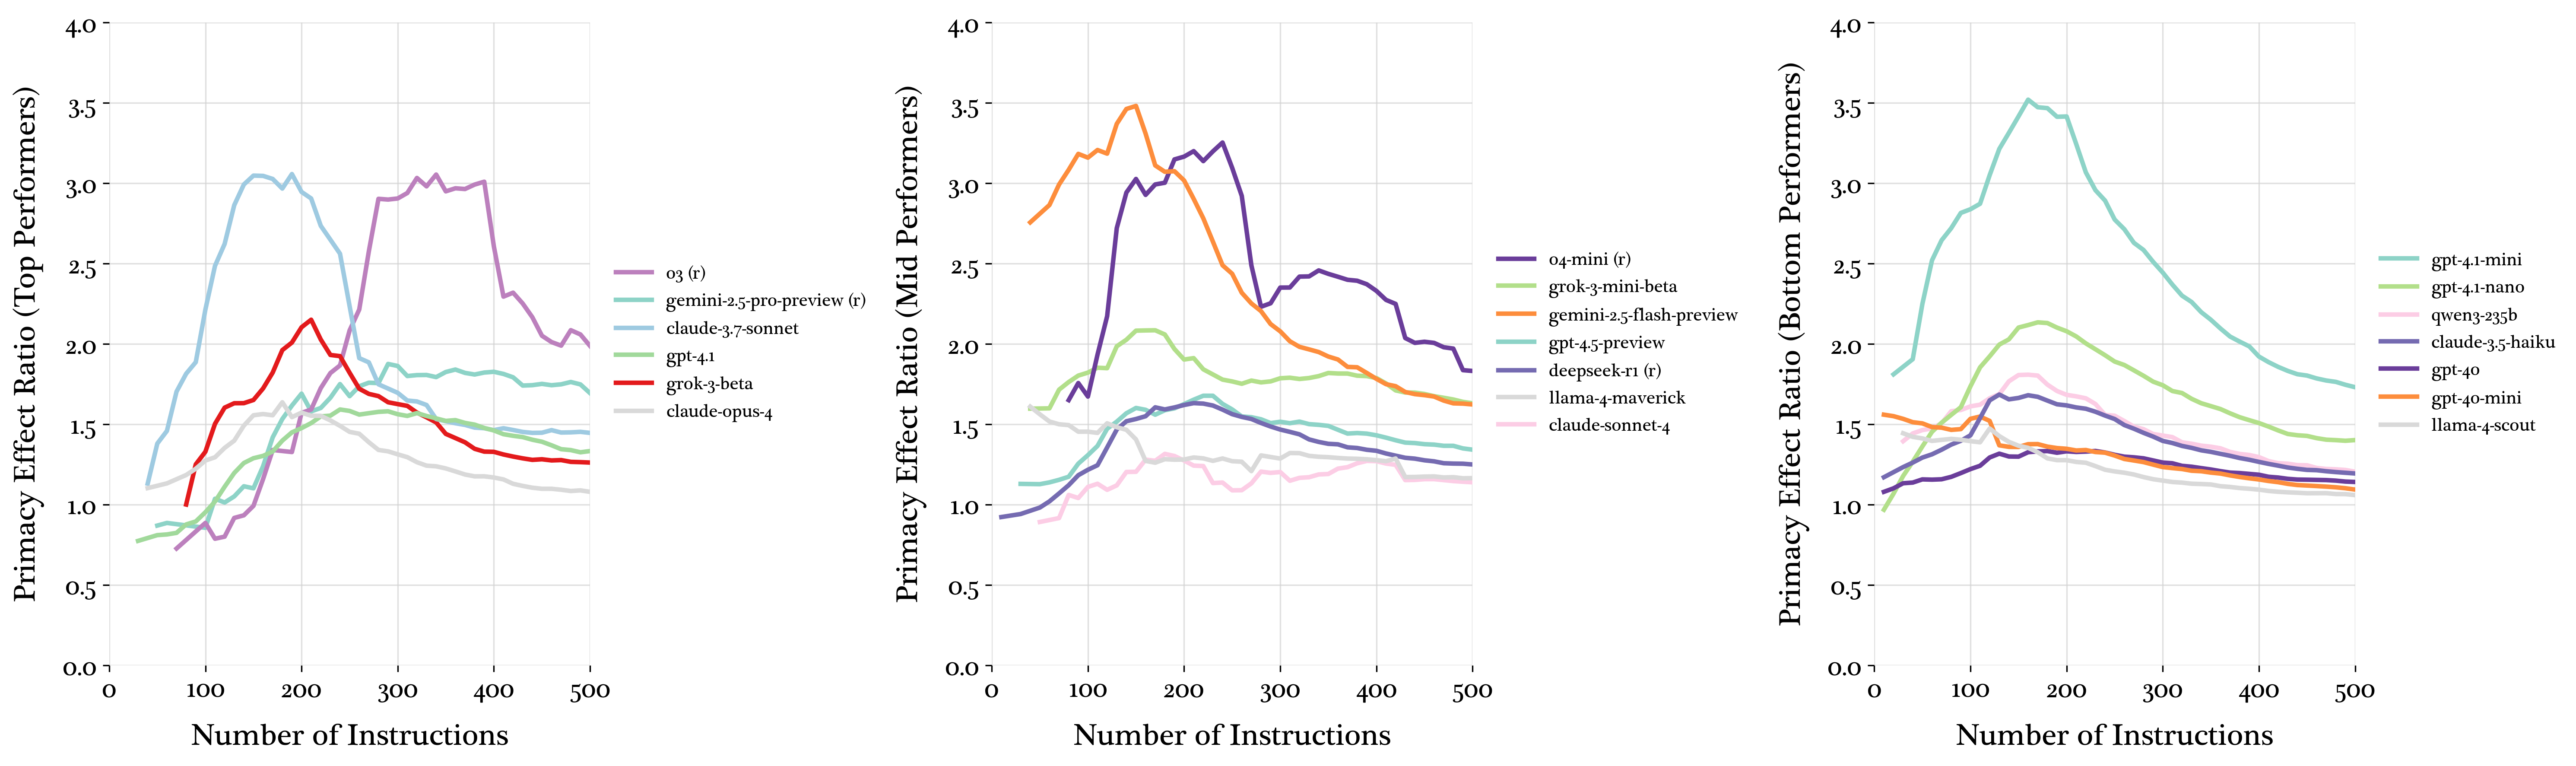
Figure 3: Each line = one model. Y-axis = primacy ratio (errors in last ⅓ ÷ first ⅓). Ratio > 1.0 (dashed line) = later instructions are violated more often. Curves smoothed with rolling window of 3.
Reasoning models earn their accuracy by spending more time thinking — latency explodes as instruction count grows. General-purpose models stay fast regardless of density.
When you divide accuracy by latency, speed wins:
By Accuracy
By Efficiency
1. o3 / gemini-2.5-pro
1. grok-3-mini
2. grok-3
2. gemini-2.5-flash
3. gpt-4.1
3. gpt-4.1-nano
Reasoning models take minutes. Smaller models take seconds. For latency-sensitive applications, a fast mid-tier model often wins.
R — Results
Does Quality Hold Up With 500 Instructions?
The Worry
We have seen that models drop instructions, skip the later ones, and stop trying under load. With all of that happening, you might wonder: does the report still make any sense?
If a model has to include 500 keywords, maybe it just stuffs them in and stops writing real sentences. So the paper also measured something beyond accuracy: basic writing quality.
The Answer
For most models, the answer is yes. Report quality stays stable from 10 instructions all the way to 500. Following more instructions does not make the writing worse.
Two Models That Broke the Pattern
o3 and o4-mini were the only models whose reports became noticeably worse as instruction count grew. At high densities, their output stopped reading like a real business report.
Why did this happen? These models produced very few tokens to begin with. o3 wrote only about 1,500 tokens when given 500 instructions. Since 500 of those words had to be keywords, roughly one out of every three words was predetermined — leaving almost no room for normal sentences to form.
An interesting contrast: grok-3 also wrote very few tokens at high densities, but its reports stayed coherent. Same constraint, different outcome — suggesting these two model families handle the tradeoff between instruction-following and writing quality in fundamentally different ways.
D — Discussion
Key Takeaways
Practical guidelines based on what the numbers tell us.
Model Selection
Use reasoning models for heavy prompts. If you need 100+ instructions followed reliably, pick o3 or gemini-2.5-pro. But expect them to be slow.
Use smaller models for light prompts. Below ~50 instructions, small models perform just as well, and they are much faster.
grok-3 hits a sweet spot. Nearly as accurate as o3 (61.9% vs. 62.8%), but faster and more consistent.
Prompt Engineering
Put your most important instructions first. Every model pays more attention to what comes earlier.
But do not rely on ordering alone. Beyond ~300 instructions, even the first ones start getting dropped.
System Design
There is a hard ceiling. Even the best model caps at ~68%. If you need more than that, break the task across multiple calls or agents.
Watch the variance, not just the average. The top models get less consistent as density goes up. High accuracy on one run does not mean high accuracy on the next.
D — Discussion
Limitations
What this paper did not test, and what it did not answer.
What This Paper Did Not Test
Only one kind of instruction. Include a keyword. No logical rules, no formatting, no instructions that depend on each other. We do not know what happens when you mix different instruction types at high density.
Only one task. Business report writing. We do not know if the same patterns hold for code, chat, or summaries.
Only English. Other languages were not tested.
Only one vocabulary source. Keywords came from U.S. corporate filings. Results might differ with everyday words.
What This Paper Did Not Answer
Why do the three degradation patterns happen? The paper describes them but does not explain the cause.
Do these patterns repeat across different tasks and topics?